Last year, I posted this question. Today, the New York Times announced that "Around the world, extreme has become the new commonplace." http://www.nytimes.com/2013/01/11/science/earth/extreme-weather-grows-in-frequency-and-intensity-around-world.html This is in response to record cold in Europe and north Asia, record heat in Australia and Brazil, and unusual storms in the Middle East and Pakistan. This year has been marked by an outbreak of extreme weather so global in scale and so continuous in time that it cannot be regarded as an unlikely concatenation of unlikely events. These events are being driven by profound, large-scale changes in the oceans and atmosphere, not by isolated chaotic responses to small changes. This is the way of the warmer world.
Friday, January 11, 2013

Friday, October 26, 2012
Storm Forecasting, The xkcd Version
xkcd is one of the most interesting commentaries I know on science, math, life, the universe, and everything... Today, they offer a highly amusing look back at the late 2005 hurricane season. If you haven't seen it, check it out at http://xkcd.com/1126/. And, as always, be sure to check out the mouseover.
Wednesday, October 24, 2012
Models and Forecasts: Sandy Edition
A few days ago, I blogged about the impossibility of predicting chaotic systems. One characteristics of chaotic systems is that the behavior of those systems over time can be said to be sensitively dependent on initial conditions. That means that small, seemingly insignificant differences in the inputs to the system may result in major differences in the behaviors of the system over time. The current forecast models for hurricane Sandy are a great example of this.
Sandy originated in the western Gulf of Mexico and is currently crossing over Jamaica, moving essentially due north toward Haiti and then the Bahamas. For the short-term forecast, nearly every forecast agrees, however, beginning Monday morning, there is a remarkable divergence in the forecast paths. Below are the model tracks from the National Weather Service Environmental Modeling Center at the National Center for Environmental Prediction.
 There is a remarkable divergence of paths on this map, with a spread of nearly 120 degrees in the direction of motion of the storm, leading to predictions ranging from a landfall on the Delmarva Peninsula through landfalls all the way up the rest of the Northeast coast, to models showing Sandy turning harmlessly out toward the central Atlantic Ocean. One of the most widely respected models, the GFS model, shows Sandy looping east and then back west to come ashore in southern Maine, cross the White Mountains and dissipate over the Adirondack Mountains of northern New York. In addition to track uncertainty, there is considerable variation in the forecast central pressure, which has implication for winds, surge, and rainfall and therefore for potential hazards. MyFoxHurricane has some nice barometric pressure map visualizations of the European and GFS models.
Here is what the National Hurricane Center is saying about the long-range potential for Sandy:
Sandy originated in the western Gulf of Mexico and is currently crossing over Jamaica, moving essentially due north toward Haiti and then the Bahamas. For the short-term forecast, nearly every forecast agrees, however, beginning Monday morning, there is a remarkable divergence in the forecast paths. Below are the model tracks from the National Weather Service Environmental Modeling Center at the National Center for Environmental Prediction.
 There is a remarkable divergence of paths on this map, with a spread of nearly 120 degrees in the direction of motion of the storm, leading to predictions ranging from a landfall on the Delmarva Peninsula through landfalls all the way up the rest of the Northeast coast, to models showing Sandy turning harmlessly out toward the central Atlantic Ocean. One of the most widely respected models, the GFS model, shows Sandy looping east and then back west to come ashore in southern Maine, cross the White Mountains and dissipate over the Adirondack Mountains of northern New York. In addition to track uncertainty, there is considerable variation in the forecast central pressure, which has implication for winds, surge, and rainfall and therefore for potential hazards. MyFoxHurricane has some nice barometric pressure map visualizations of the European and GFS models.
Here is what the National Hurricane Center is saying about the long-range potential for Sandy:
THE INITIAL MOTION IS 015/11. THE SHORT-TERM TRACK FORECAST
REASONING REMAINS UNCHANGED FOR THE FIRST COUPLE OF DAYS...AS SANDY
SHOULD MOVE GENERALLY NORTHWARD INTO A BREAK IN THE SUBTROPICAL
RIDGE OVER THE BAHAMAS AS IT INTERACTS WITH AN UPPER-LEVEL LOW TO
ITS WEST. LATE IN THE PERIOD...THERE REMAINS CONSIDERABLE SPREAD IN
THE GUIDANCE DUE TO DIFFERENCES IN HOW MUCH SANDY INTERACTS WITH
ANOTHER TROUGH MOVING INTO THE NORTHEASTERN UNITED STATES. THE
ECMWF HAS BEEN CONSISTENT IN SHOWING MORE INTERACTION AND A TRACK
FARTHER WEST...WHILE THE GFS SHOWS SANDY TURNING EAST AND MISSING
THE TROUGH. OVERALL MORE OF THE GUIDANCE HAS BEEN TRENDING TOWARD
SHOWING MORE INTERACTION WITH THE EASTERN U.S. TROUGH LATE IN THE
PERIOD. GIVEN THIS TREND...THE NHC FORECAST HAS BEEN ADJUSTED TO THE
LEFT AT DAYS 4 AND 5...AND LIES ROUGHLY BETWEEN THE ECMWF AND THE
TVCA MULTI-MODEL CONSENSUS. NEEDLESS TO SAY...THE TRACK FORECAST
UNCERTAINTY REMAINS HIGH AT THE END OF THE PERIOD.
In other words, "We don't know, either." Early next week, the storm will have moved far enough north that the uncertainty should have diminished somewhat. It could be an interesting Halloween, stay tuned.
Monday, October 22, 2012
Dark Day for Science
Today is a very bad day for seismology and for all of science. If you have not already heard, 6 Italian seismologists, including the Director of the National Earthquake Center, and the past-president of the National Institute of geophysics, were convicted of manslaughter, along with a former governmental official. The charges resulted from the belief that scientists were too reassuring in the aftermath of a couple of small tremors that turned out to be foreshocks of the deadly L'Aquila quake in 2009.
Many earth system behaviors are inherently chaotic, earthquakes included. These behaviors are, as a result, inherently unpredictable. There are small earthquakes more or less continuously in the Apennines, the modern front line of the ongoing collision between the African and Eurasian plates. The vast majority of these small quakes will be the harbingers of... nothing at all. When to issue a warning to the public is one of the most fundamental problems of earthquake hazards. Raise the alert level every time there is a minor tremor and pretty soon, people begin to ignore the alerts. Fail to issue an alert until you are sure there will be a quake and you might as well not have a warning system because you will never be sure. There is no research that says just how to walk this tightrope between too much warning and too little warning. This is the trap the Italian seismologists have found themselves in. The authorities, blessed with hindsight, have essentially said, "See, you had warning signs, you should have told every one."
A magnitude 5.5 earthquake happened just yesterday on the San Andreas fault in central California. Should Californians have been warned to evacuate because this is potentially a foreshock? Most of us would agree that this would be foolhardy. M 5 quakes happen regularly along the San Andreas and related fault systems in California without presaging anything. Yet one day, one of those shocks might very well be the foreshock of a much larger quake, one that wreaks devastation across a wide area. What is the responsible thing to do? Who should decide how much warning is appropriate?
Those convicted in Italy are among the top seismologists in the world. Even if these convictions are overturned, they will definitely inhibit important research in one of the most seismically active parts of the world. At this point the Italians have essentially guaranteed that they will have less information and less potential warning of future quakes, because no sane geophysicist would choose to work there. This ruling will undoubtedly also have a chilling effect on volcanological research and Italy is also the home of a number of dangerously active volcanoes. How sad for all involved, but especially how sad for the Italian people who, in the end, need more information, not less, in order to live as safely as they can in their active homeland.
Many earth system behaviors are inherently chaotic, earthquakes included. These behaviors are, as a result, inherently unpredictable. There are small earthquakes more or less continuously in the Apennines, the modern front line of the ongoing collision between the African and Eurasian plates. The vast majority of these small quakes will be the harbingers of... nothing at all. When to issue a warning to the public is one of the most fundamental problems of earthquake hazards. Raise the alert level every time there is a minor tremor and pretty soon, people begin to ignore the alerts. Fail to issue an alert until you are sure there will be a quake and you might as well not have a warning system because you will never be sure. There is no research that says just how to walk this tightrope between too much warning and too little warning. This is the trap the Italian seismologists have found themselves in. The authorities, blessed with hindsight, have essentially said, "See, you had warning signs, you should have told every one."
A magnitude 5.5 earthquake happened just yesterday on the San Andreas fault in central California. Should Californians have been warned to evacuate because this is potentially a foreshock? Most of us would agree that this would be foolhardy. M 5 quakes happen regularly along the San Andreas and related fault systems in California without presaging anything. Yet one day, one of those shocks might very well be the foreshock of a much larger quake, one that wreaks devastation across a wide area. What is the responsible thing to do? Who should decide how much warning is appropriate?
Those convicted in Italy are among the top seismologists in the world. Even if these convictions are overturned, they will definitely inhibit important research in one of the most seismically active parts of the world. At this point the Italians have essentially guaranteed that they will have less information and less potential warning of future quakes, because no sane geophysicist would choose to work there. This ruling will undoubtedly also have a chilling effect on volcanological research and Italy is also the home of a number of dangerously active volcanoes. How sad for all involved, but especially how sad for the Italian people who, in the end, need more information, not less, in order to live as safely as they can in their active homeland.
Tuesday, September 18, 2012
Is extreme the new "normal"?
Today, a low pressure system is pushing through northern New York and New England. It's a relatively classic apostrophe-shaped mid-latitude storm system.

However, warning were just issued for an area just northwest of us to expect 4-7 inches of rain from this storm as a result of heavy downpours from the passage of a train of thunderstorms. This is a remarkable amount of rain to come out of such a system, from a historical perspective. The 24-hour rainfall record at Reading is about 8.5 inches, set during the landfall of Hurricane Agnes in 1972. It is conceivable that some localities in this region may set new single-day rainfall records today. And eastern Pennsylvania is not alone in its experience of this storm. The storm totals (see below), as of 3 pm today, exceed 6" in parts of North Carolina and exceed 4" in wide areas of North Carolina and Kentucky and some additional rain is possible in those areas.

Several flash flood and flood warnings have been issued for our region and stream and river hydrographs are rising very rapidly. No major flooding is expected, thankfully, but there is clearly a lot of moisture in this system.
The occurrence of more frequent, more extreme rainfall events is the flip side of the occurrence of more frequent more extreme droughts, as both are driven by a warming atmosphere. As Earth warms, more liquid water can evaporate into the atmosphere. As the low pressure system forms, and air is drawn in and cooled, the balance between evaporation and condensation shifts and condensation increases, eventually resulting in rain. Since there is more vapor available, more rainfall can occur (thanks to the Bad Meteorology blog for helping me get this straight). Hurricanes are famous for their ability to delivering drenching rainfall in large part because they collect water vapor into their circulating air over very warm tropical seas. As temperatures increase everywhere, we should expect more non-tropical systems to deliver deluges and this is in fact what climate modelers have been predicting to come from a warming world. All of which leads me back to the title question... Is this just a singular isolated event, or is this now the weather we can expect on a regular basis, the new normal?

However, warning were just issued for an area just northwest of us to expect 4-7 inches of rain from this storm as a result of heavy downpours from the passage of a train of thunderstorms. This is a remarkable amount of rain to come out of such a system, from a historical perspective. The 24-hour rainfall record at Reading is about 8.5 inches, set during the landfall of Hurricane Agnes in 1972. It is conceivable that some localities in this region may set new single-day rainfall records today. And eastern Pennsylvania is not alone in its experience of this storm. The storm totals (see below), as of 3 pm today, exceed 6" in parts of North Carolina and exceed 4" in wide areas of North Carolina and Kentucky and some additional rain is possible in those areas.

Several flash flood and flood warnings have been issued for our region and stream and river hydrographs are rising very rapidly. No major flooding is expected, thankfully, but there is clearly a lot of moisture in this system.
The occurrence of more frequent, more extreme rainfall events is the flip side of the occurrence of more frequent more extreme droughts, as both are driven by a warming atmosphere. As Earth warms, more liquid water can evaporate into the atmosphere. As the low pressure system forms, and air is drawn in and cooled, the balance between evaporation and condensation shifts and condensation increases, eventually resulting in rain. Since there is more vapor available, more rainfall can occur (thanks to the Bad Meteorology blog for helping me get this straight). Hurricanes are famous for their ability to delivering drenching rainfall in large part because they collect water vapor into their circulating air over very warm tropical seas. As temperatures increase everywhere, we should expect more non-tropical systems to deliver deluges and this is in fact what climate modelers have been predicting to come from a warming world. All of which leads me back to the title question... Is this just a singular isolated event, or is this now the weather we can expect on a regular basis, the new normal?
Sunday, August 26, 2012
Earthquake Swarm near Brawley, CA
This afternoon, in the course of a few hours, dozens of earthquakes shook the area around Brawley, CA along the southeastern side of the Salton Sea. The largest of these quakes had a moment magnitude of 5.5 and a Mercalli Intensity at the epicenter of VII. Below is a map and a partial list of the larger quakes, from the USGS.

On this map, the two darkest red traces, are the traces of the San Andreas fault. If you were to walk along either strand, toward the other, you would have to make a big step to the right, right at Brawley.
Because the San Andreas fault is a right-lateral strike slip fault, the western portion of this map is moving to the northwest and the eastern portion of this map is moving to the southeast, relative to each other. This means that the crust at this stepover is tending to have a big hole ripped in it. Since we cannot rip big holes in the crust, the crust instead stretches to fill in the gap. In the upper crust it does this by forming normal faults. The predicted orientation of these normal faults is about 120 degrees away from the trace of the San Andreas fault. Interestingly, the orientation of the swarm at Brawley is more nearly perpendicular to the San Andreas trend, as is the trend of topographic features in the area, suggesting this is a long-lived fault orientation. Update (8/27/12) The centroid moment tensor solution http://earthquake.usgs.gov/earthquakes/eqarchives/gcmt/neic_c000c7i2_gcmt.php shows that the largest of these quakes moved with slightly oblique strike-slip motion on either a right-lateral fault paralleling the San Andreas trend or a left-lateral fault perpendicular to it.
In this area, the Salton Sea owes its existence to these normal faults and to the stretching of the crust. The stretching occurring at this stepover is producing a depression, the Salton Sink, which filled with water when a 1905 flood overwhelmed a newly-constructed irrigation canal and diverted water from the Colorado River into the depression. The diverted waters rapidly eroded the soft soils in the area, creating new river channels. The flooding of the Salton Sink went on for two years before finally being stopped, leaving the large puddle of water we now call the Salton Sea.
Earthquake swarms are distinctive in that they have several to many quakes of similar magnitude along a fault system, as opposed to the more common pattern of a single large mainshock followed by many smaller aftershocks. There are many reasons that have been suggested, including effects of fluid or magmatic pressures. There are no active volcanoes at Brawley, so we can rule out volcanic mechanisms, but it is possible that some sort of hydrothermal or other fluid flow played a role.

On this map, the two darkest red traces, are the traces of the San Andreas fault. If you were to walk along either strand, toward the other, you would have to make a big step to the right, right at Brawley.
Because the San Andreas fault is a right-lateral strike slip fault, the western portion of this map is moving to the northwest and the eastern portion of this map is moving to the southeast, relative to each other. This means that the crust at this stepover is tending to have a big hole ripped in it. Since we cannot rip big holes in the crust, the crust instead stretches to fill in the gap. In the upper crust it does this by forming normal faults. The predicted orientation of these normal faults is about 120 degrees away from the trace of the San Andreas fault. Interestingly, the orientation of the swarm at Brawley is more nearly perpendicular to the San Andreas trend, as is the trend of topographic features in the area, suggesting this is a long-lived fault orientation. Update (8/27/12) The centroid moment tensor solution http://earthquake.usgs.gov/earthquakes/eqarchives/gcmt/neic_c000c7i2_gcmt.php shows that the largest of these quakes moved with slightly oblique strike-slip motion on either a right-lateral fault paralleling the San Andreas trend or a left-lateral fault perpendicular to it.
In this area, the Salton Sea owes its existence to these normal faults and to the stretching of the crust. The stretching occurring at this stepover is producing a depression, the Salton Sink, which filled with water when a 1905 flood overwhelmed a newly-constructed irrigation canal and diverted water from the Colorado River into the depression. The diverted waters rapidly eroded the soft soils in the area, creating new river channels. The flooding of the Salton Sink went on for two years before finally being stopped, leaving the large puddle of water we now call the Salton Sea.
Earthquake swarms are distinctive in that they have several to many quakes of similar magnitude along a fault system, as opposed to the more common pattern of a single large mainshock followed by many smaller aftershocks. There are many reasons that have been suggested, including effects of fluid or magmatic pressures. There are no active volcanoes at Brawley, so we can rule out volcanic mechanisms, but it is possible that some sort of hydrothermal or other fluid flow played a role.
Monday, May 2, 2011
Change in my work email
Hi,
My work email is changing. It is now david@davincisciencecenter.org Please update your records accordingly. While you are at it, why not check out our new website at www.davincisciencecenter.org?
Thanks,
Dave Smith
My work email is changing. It is now david@davincisciencecenter.org Please update your records accordingly. While you are at it, why not check out our new website at www.davincisciencecenter.org?
Thanks,
Dave Smith
Thursday, February 3, 2011
The Arctic would like its winter back
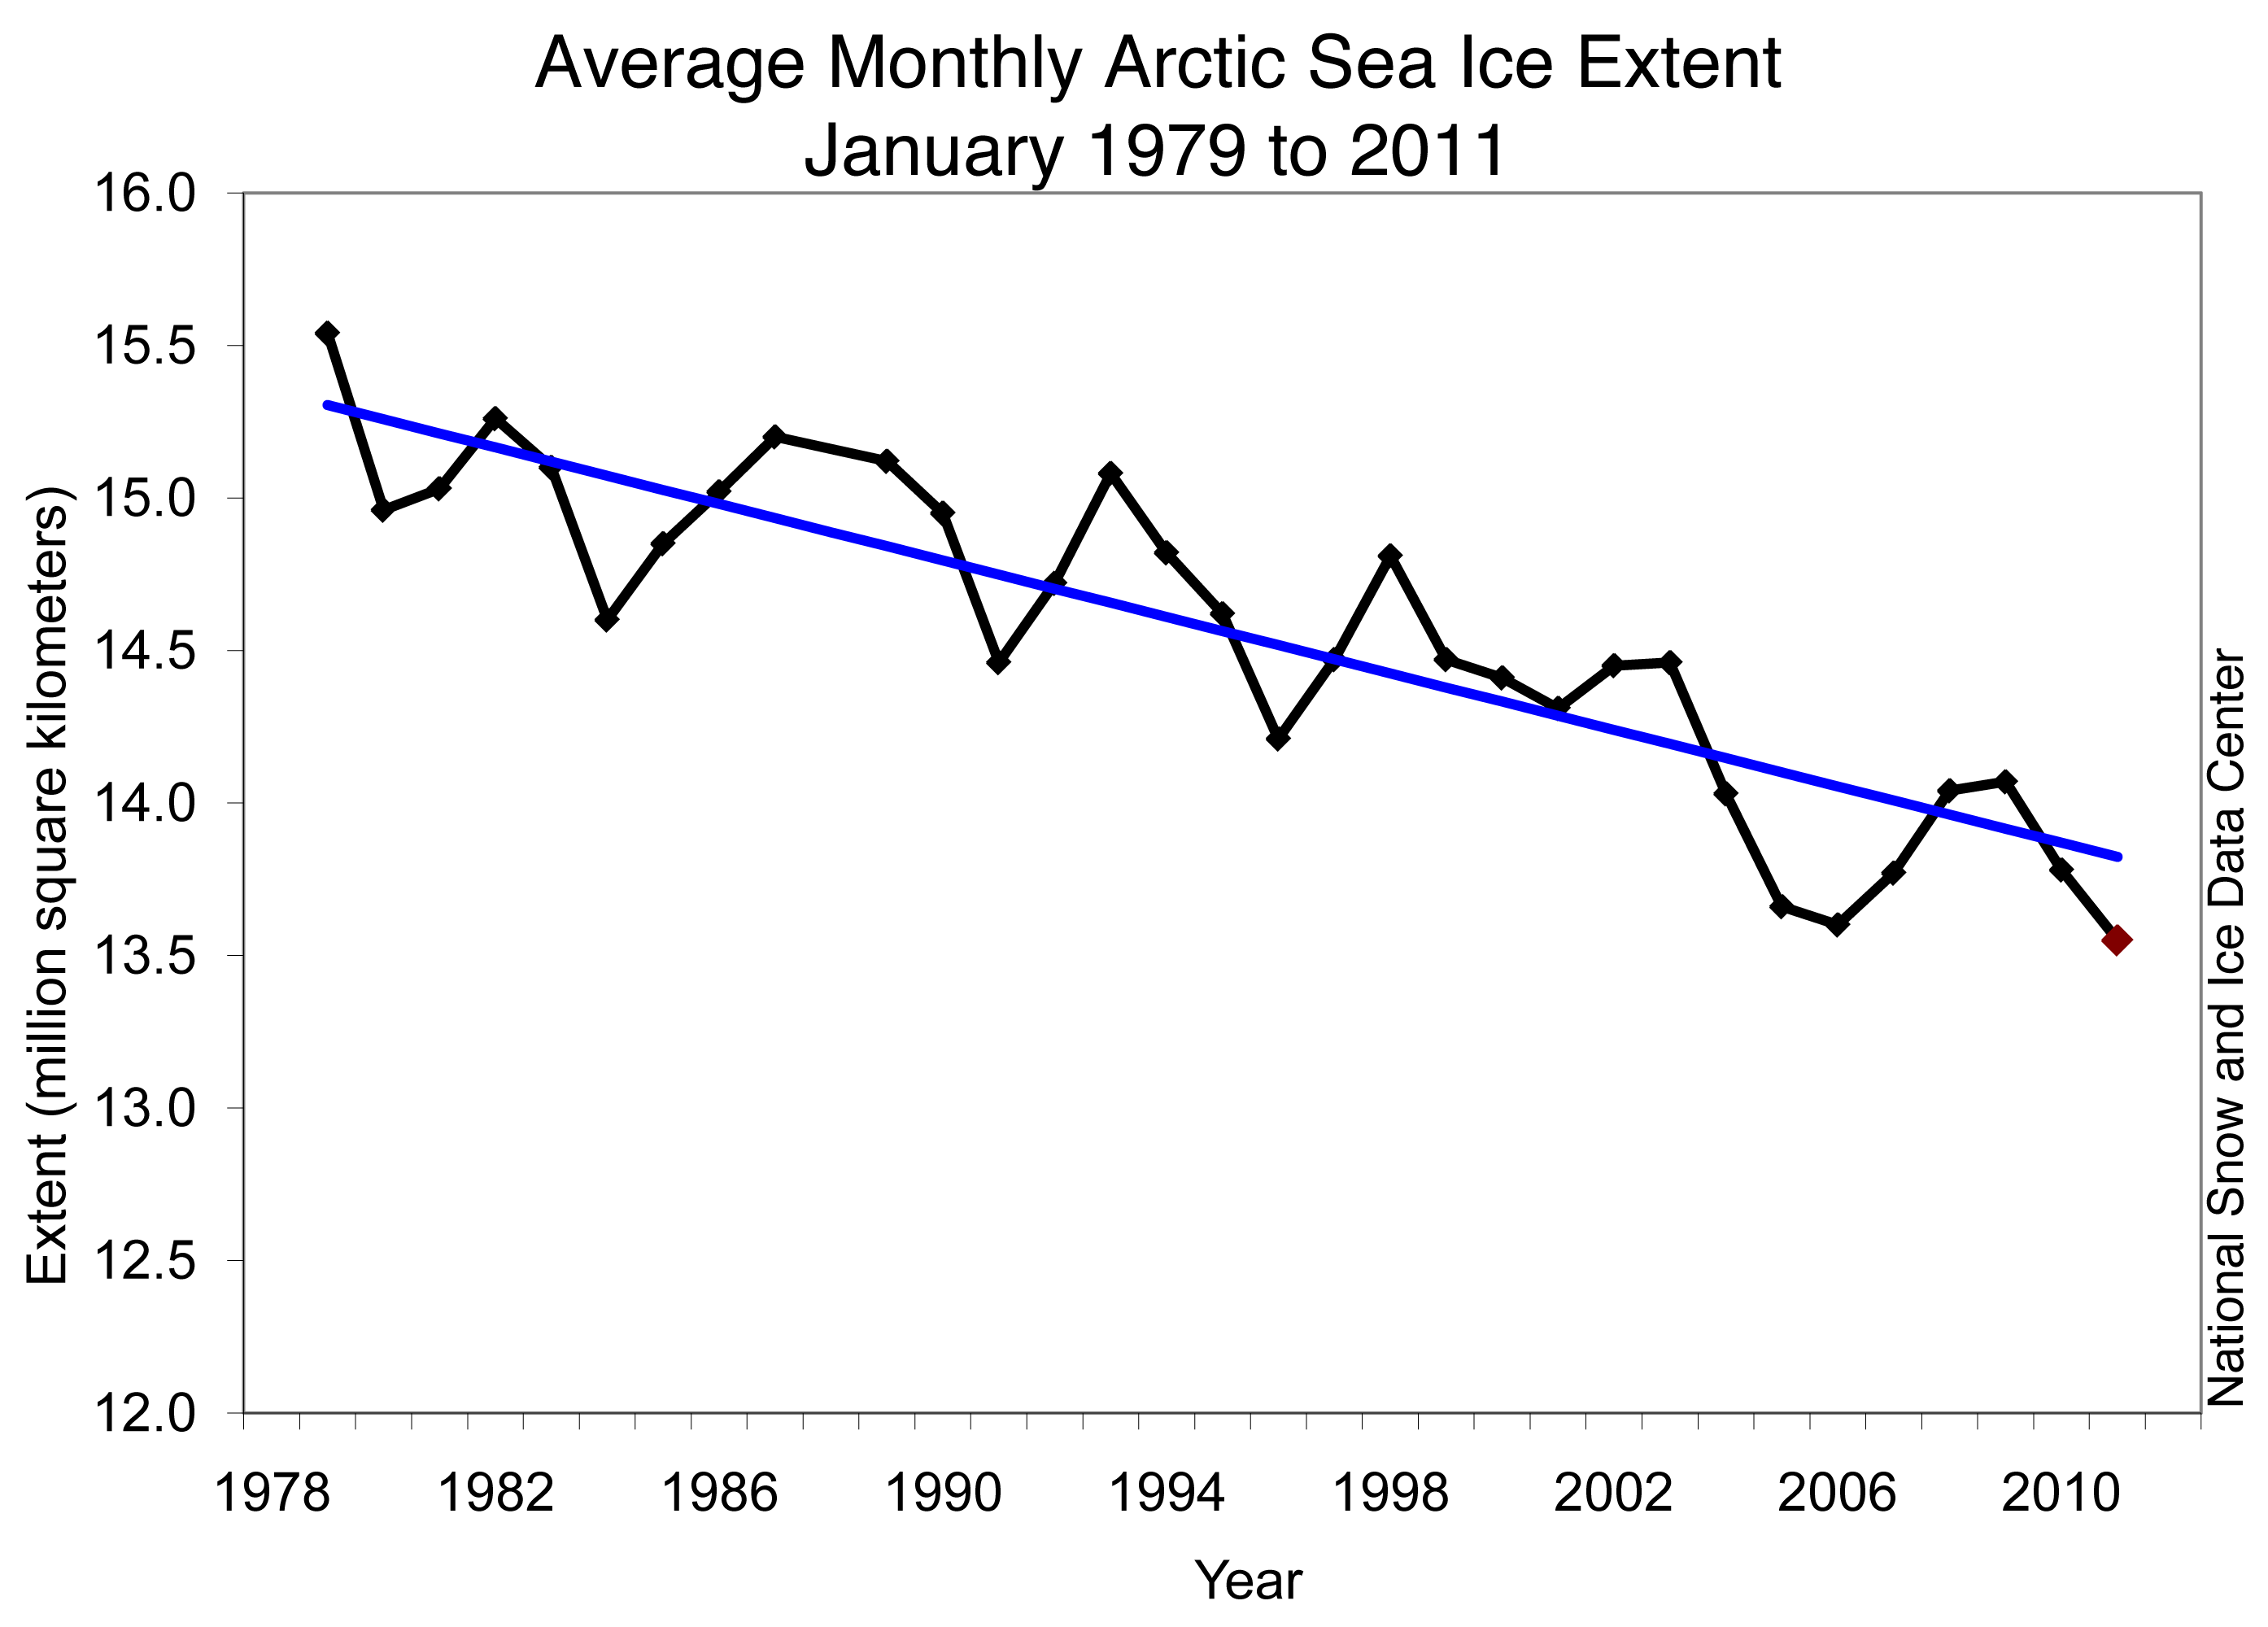 As we shiver here in the Northeast, it is common to hear comments that embed two major misconceptions - comments like "whatever happened to global warming?" There are two things wrong with these statements:
1. Weather does not equal climate
2. The United States does not equal the world.
Although we have had unusually cold winter weather over much of the lower 48 states this year, the Arctic has been having yet more unusually warm weather. One piece of evidence is the record low extent of Arctic sea ice. The graph above shows the decline in the average annual extent. To be sure, the Arctic melt-off is much more severe in summer than in winter and these data points are year-long averages that incorporate summer extent, but there is still a clear trend consistent with significant warming of the Arctic.
This winter's weather in the Eastern US is most likely due to the North Atlantic Oscillation - a periodic rearrangement of the dominant weather systems - high latitude high pressure and mid-latitude low pressure - that changes the storm tracks across the northeastern United States and parts of Europe as well. The NAO is similar to its cousin ENSO, the El Nino Southern Oscillation. It seems to be that El Nino and NAO are not linked, although both have profound hemispheric, even global, impacts. Although the deeper causes of the NAO are not yet well understood, there is growing understanding of how to predict it and what the resulting effects on the local weather will be. What is also not known is the extent to which additions of fossil fuel carbon dioxide and the resulting warming may create a feedback with the NAO. Although we are currently in a negative NAO, it has been unusually positive for most of the past two decades, which is intriguing but certainly not definitive. See Professor David Stephenson's NAO page http://www1.secam.ex.ac.uk/cat/NAO for more detailed description and history.
Tuesday, December 14, 2010
What Happens When the Science Really IS Shaky
The scientific findings indicating that anthropogenic climate change is occurring at an increasing rate, with far-reaching consequences are about as robust as science ever gets. Nevertheless, they are under ceaseless and increasingly aggressive political attack. So, how can one tell if a scientific idea has any merit in the face of all this political grandstanding?
It's quite simple, really. Sit back for a short time and watch other scientists react to it.
Two weeks ago, NASA scientists published a paper in Science, http://www.sciencemag.org/content/early/2010/12/01/science.1197258 presenting evidence that arsenic could replace phosphorus in at least one species of living organism, an extremophile bacterium in Mono Lake, CA. This would be, if true, a Really. Big. Deal. So people read the paper. Very. Carefully. In less than a week, scientists have come pouring out of the woodwork, discrediting the research findings and techniques used in the paper. See http://rrresearch.blogspot.com/2010/12/arsenic-associated-bacteria-nasas.html and the comments therein for one example of the critique. At the very least, there remains a great deal of more careful data collection to be done before any sort of confidence can be assigned to these findings.
This is exactly the sort of response that scientists expect and desire, but with the spread of the blogosphere, it is now much more public than it ever has been, which means that even casual readers can see the testing of scientific ideas in action. If you believe that scientists tend to stick up for each other in some kind of secret society, take another look at those comments on RRResearch - it's a feeding frenzy. This feeding frenzy is not an aberration, either. This is how scientists talk to each other, even scientists who fundamentally respect each other.
When ordinary people think someone they know and like has made an error, they may elect to keep it to themselves to protect the relationship. People don't generally go to a dinner party where the chicken soup is too salty and say to the host, "You know, I've reviewed your technique and you clearly forget to account for the effect of increasing concentration due to evaporation losses." But, in science that is exactly what scientists do to each other. Unchallenged mistakes are a big problem so it is best to shed light on the problem immediately. Ideally, this happens pre-publication, in the peer-review process. However, no system of review is foolproof and editors may also opt to publish something they think is important, even in the face of reviewer's objections. It's not yet clear what happened during the publication of the NASA results, but it should be clear in the aftermath that poor science, once exposed to the view of the scientific community, does not stand for long.
Big news in science, just as in other fields, can get a lot of media hype and that hype may or may not be justified in the end. Ditto for political attention. If you want to know if the science is any good, however, don't pay any attention to the media or the politicos. Instead, pay attention to the scientists.
It's quite simple, really. Sit back for a short time and watch other scientists react to it.
Two weeks ago, NASA scientists published a paper in Science, http://www.sciencemag.org/content/early/2010/12/01/science.1197258 presenting evidence that arsenic could replace phosphorus in at least one species of living organism, an extremophile bacterium in Mono Lake, CA. This would be, if true, a Really. Big. Deal. So people read the paper. Very. Carefully. In less than a week, scientists have come pouring out of the woodwork, discrediting the research findings and techniques used in the paper. See http://rrresearch.blogspot.com/2010/12/arsenic-associated-bacteria-nasas.html and the comments therein for one example of the critique. At the very least, there remains a great deal of more careful data collection to be done before any sort of confidence can be assigned to these findings.
This is exactly the sort of response that scientists expect and desire, but with the spread of the blogosphere, it is now much more public than it ever has been, which means that even casual readers can see the testing of scientific ideas in action. If you believe that scientists tend to stick up for each other in some kind of secret society, take another look at those comments on RRResearch - it's a feeding frenzy. This feeding frenzy is not an aberration, either. This is how scientists talk to each other, even scientists who fundamentally respect each other.
When ordinary people think someone they know and like has made an error, they may elect to keep it to themselves to protect the relationship. People don't generally go to a dinner party where the chicken soup is too salty and say to the host, "You know, I've reviewed your technique and you clearly forget to account for the effect of increasing concentration due to evaporation losses." But, in science that is exactly what scientists do to each other. Unchallenged mistakes are a big problem so it is best to shed light on the problem immediately. Ideally, this happens pre-publication, in the peer-review process. However, no system of review is foolproof and editors may also opt to publish something they think is important, even in the face of reviewer's objections. It's not yet clear what happened during the publication of the NASA results, but it should be clear in the aftermath that poor science, once exposed to the view of the scientific community, does not stand for long.
Big news in science, just as in other fields, can get a lot of media hype and that hype may or may not be justified in the end. Ditto for political attention. If you want to know if the science is any good, however, don't pay any attention to the media or the politicos. Instead, pay attention to the scientists.
Friday, May 14, 2010
The True Face of Scientific Dissent
We hear a lot about how scientists are supposedly squelching dissent on issues such as evolution and climate change. This is nonsense, but it might be helpful to have a case study of how accespting science is to dissenting views, as long as they are presented in the form of scientific arguments - novel explanations that are supported by data and analysis.
The March 2010 issue of Reviews of Geophysics just arrived in my mailbox. In this issue is a paper by Kutcherov and Krayushkin on "Deep-Seated Abiogenic Origin of Petroleum: From Geologic Assessment to Physical Theory." Most petroleum geologists, reject this idea and instead accept the biogenic theory (petroleum is derived from the thermal breakdown of fatty material in the remains of dead single-celled organisms in oxygen-poor sediments.) Not only that, but the abiogenic hypothesis posits that petroleum is super-abundant and that we could find it anywhere. If this were true it could case a global crash in petroleum prices, which depend on a belief in scarcity. There is a powerful incentive to suppress this hypothesis in favor of the current dogma, especially by Western petroleum geologists, most of whom work for petroleum companies. So how did this article get published?
It's very simple, they wrote it and submitted it, but most importantly, they generated evidence and the editors could not find any substantive problems with their data. These authors create a case, documenting the production of hydrocarbons from the reduction of carbonates at mantle temperatures and pressures. These experiments were not easy to do, but they document a methodology that is reasonable and they provide results that match natural petroleum profiles in at least a few cases.
This paper may well be wrong. In fact, it still seems very unlikely that most of the petroleum we extract came from anything other than dead organisms. However, the editors of the journal not only published the paper, they celebrated it, by putting two of the authors' illustrations on the front cover of this issue. That's because, whether they are ultimately right or not, the authors have produced an important new body of data that should cause everyone to re-examine the existing data and their ideas on the subject.
The truth of the matter is that novel scientific ideas, no matter how far-fetched or anti-orthodox they are, usually get more press than the accepted idea, not less, provided that they are scientific ideas, based in data and supported by analysis. The next time someone tells you that a scientific alternative is being suppressed by scientists, ask to see their data and their analysis. It is very likely that the alternative is not so scientific, after all. Otherwise, it would probably be on the front cover of some journal somewhere.
The March 2010 issue of Reviews of Geophysics just arrived in my mailbox. In this issue is a paper by Kutcherov and Krayushkin on "Deep-Seated Abiogenic Origin of Petroleum: From Geologic Assessment to Physical Theory." Most petroleum geologists, reject this idea and instead accept the biogenic theory (petroleum is derived from the thermal breakdown of fatty material in the remains of dead single-celled organisms in oxygen-poor sediments.) Not only that, but the abiogenic hypothesis posits that petroleum is super-abundant and that we could find it anywhere. If this were true it could case a global crash in petroleum prices, which depend on a belief in scarcity. There is a powerful incentive to suppress this hypothesis in favor of the current dogma, especially by Western petroleum geologists, most of whom work for petroleum companies. So how did this article get published?
It's very simple, they wrote it and submitted it, but most importantly, they generated evidence and the editors could not find any substantive problems with their data. These authors create a case, documenting the production of hydrocarbons from the reduction of carbonates at mantle temperatures and pressures. These experiments were not easy to do, but they document a methodology that is reasonable and they provide results that match natural petroleum profiles in at least a few cases.
This paper may well be wrong. In fact, it still seems very unlikely that most of the petroleum we extract came from anything other than dead organisms. However, the editors of the journal not only published the paper, they celebrated it, by putting two of the authors' illustrations on the front cover of this issue. That's because, whether they are ultimately right or not, the authors have produced an important new body of data that should cause everyone to re-examine the existing data and their ideas on the subject.
The truth of the matter is that novel scientific ideas, no matter how far-fetched or anti-orthodox they are, usually get more press than the accepted idea, not less, provided that they are scientific ideas, based in data and supported by analysis. The next time someone tells you that a scientific alternative is being suppressed by scientists, ask to see their data and their analysis. It is very likely that the alternative is not so scientific, after all. Otherwise, it would probably be on the front cover of some journal somewhere.
The Death of Disciplinarity
New work, funded by the National Science Foundation, provides more evidence that traditional disciplinary boundaries in the sciences have become essentially meaningless.
Biology, chemistry, physics, and engineering have effectively ceased to exist as separate disciplines. How long will it take our schools and colleges to recognize that and respond? Will it be fast enough?
- Robots that have no circuity and no motors
- Programs that are written in DNA molecules, not a computer language
- Chemical reactions that create engineered structures
Biology, chemistry, physics, and engineering have effectively ceased to exist as separate disciplines. How long will it take our schools and colleges to recognize that and respond? Will it be fast enough?
Wednesday, April 7, 2010
Flood Forums coming to Easton and Allentown in April
Many people know about floods on the Delaware River, but did you know floods have resulted in more than $3 million in flood insurance payments in Allentown in the last 35 years?
From our partner, Kate Brandes, at the Nurture Nature Foundation in downtown Easton comes the following announcement:
From our partner, Kate Brandes, at the Nurture Nature Foundation in downtown Easton comes the following announcement:
Nurture Nature Foundation is excited to announce upcoming community forums on flooding in Eastonand Allentown. NNF is developing a science center about flooding. We’re asking people who work and live in Easton and Allentown to share thoughts and concerns about flooding, streams, and rivers in their community. The purpose of the “Flood Forums” is to:
1) Provide feedback from community members to decision makers, and
2) Gather ideas for our developing science center on flooding
Flood forums will be held in Easton on April 18 and April 21. In Allentown, forums will be on April 19 and 20. Please see the flyers for times and locations. All participants will receive $30. You must pre-register for the events.
Please contact Kate Brandes at 610-253-4432 or kbrandes@nurturenature.org if you are interested in participating or if you have questions.
This project is being supported by the National Science Foundation and our project partners include the Museum of Science in Boston, North Carolina Museum of Life and Science, LehighUniversity, and Lafayette College. More project details are available at:http://nurturenaturecenter.org/floodforum/index.html
Tuesday, March 30, 2010
There's a volcano in my kitchen, again!
In case you missed it, Eyjafjallajökull Volcano in Iceland recently began erupting. There's a satellite image at NASA's Earth Observatory and it's been well-covered in a number of geological blogs, including Eruptions. But the most amazing thing to me is that you can watch it yourself, live, on streaming video with a fast frame rate. Go at night and you can see the glowing lava still fountaining from the vent. Enjoy, but be forewarned. If you are prone to being distracted, this could seriously impair your productivity.
Tuesday, March 16, 2010
Hooray for Texas (Really!)
Once again, the Texas State School Board has allowed the ideology of its members to dominate its discussions, leading to the curricular version of a witch hunt. Last week it was revisionist history, last year it was questioning modern science. Denying the work of generations (literally) of scientists, historians, and other thinking people, they have once again revised the standards that govern what gets taught in Texas. Since Texas is so big, it buys a lot of books, and the common wisdom is that as Texas goes, so goes the rest of the country. Major publishers need a major market and even the ones who refuse to be stooges for ideology will dumb down their materials, eliminating potentially controversial ideas, appeasing a radical minority whose ideas have little or no academic credibility. There has been a predictable amount of hand-wringing over this, but I think there might be a silver lining, at least for those of us who don't live in Texas.
I posted a link to Seth Godin's self-described rant on textbooks before. Science textbooks have repeatedly been reviewed by people without a vested interest and found wanting in both accuracy and pedagogy. They reduce complex relationships to simple lists of jargon and definitions, they cannot respond to a student's existing knowledge, and in order to sell well, they are replete with multi-color diagrams that have repeatedly been shown to confuse rather than enlighten students. Finally, in a desperate attempt to produce a book that could meet all of the mind-numbing diversity of standards in our locally-controlled education system, they are all bloated tomes, three or four times the length of comparable grade textbooks in other developed countries. They then become the de facto curriculum with teachers rushing to "cover" every chapter.
These shortcomings of science textbooks have been widely documented for some time and yet it remains an implicit assumption of American schooling that students must have textbooks and so schools continue to invest millions of dollars into a failed system making publishers wealthy, but adding no value to students' education. More enlightened districts still feel they need them, but they "buy them for use as a reference." Why buy a reference you know is inaccurate? Why pay $ for a reference at all? Excellent reference materials, from Wikipedia to the web pages and lectures of leading scientists are all available online for free. Of course, we need to teach students some media literacy to separate authoritative materials from bunk, but we need to teach them that anyway.
Back to Texas. An excellent way to begin to teach information literacy is to teach students to identify and reject sources of information that are tainted by bias. Any textbook rewritten to conform with the new Texas standards surely meets this criterion. This is where Texas may have done science education a huge favor. In the storm of publicity surrounding the effects of the new standards on textbooks, I have begun to see thoughtful science teachers questioning whether they really want their district to buy them new books next year. If Texas can finally wean education from textbooks, then hooray for Texas!
I posted a link to Seth Godin's self-described rant on textbooks before. Science textbooks have repeatedly been reviewed by people without a vested interest and found wanting in both accuracy and pedagogy. They reduce complex relationships to simple lists of jargon and definitions, they cannot respond to a student's existing knowledge, and in order to sell well, they are replete with multi-color diagrams that have repeatedly been shown to confuse rather than enlighten students. Finally, in a desperate attempt to produce a book that could meet all of the mind-numbing diversity of standards in our locally-controlled education system, they are all bloated tomes, three or four times the length of comparable grade textbooks in other developed countries. They then become the de facto curriculum with teachers rushing to "cover" every chapter.
These shortcomings of science textbooks have been widely documented for some time and yet it remains an implicit assumption of American schooling that students must have textbooks and so schools continue to invest millions of dollars into a failed system making publishers wealthy, but adding no value to students' education. More enlightened districts still feel they need them, but they "buy them for use as a reference." Why buy a reference you know is inaccurate? Why pay $ for a reference at all? Excellent reference materials, from Wikipedia to the web pages and lectures of leading scientists are all available online for free. Of course, we need to teach students some media literacy to separate authoritative materials from bunk, but we need to teach them that anyway.
Back to Texas. An excellent way to begin to teach information literacy is to teach students to identify and reject sources of information that are tainted by bias. Any textbook rewritten to conform with the new Texas standards surely meets this criterion. This is where Texas may have done science education a huge favor. In the storm of publicity surrounding the effects of the new standards on textbooks, I have begun to see thoughtful science teachers questioning whether they really want their district to buy them new books next year. If Texas can finally wean education from textbooks, then hooray for Texas!
Saturday, February 27, 2010
Massive Earthquake Hits Seismic "Gap" in Chile
Last night a M 8.8 earthquake struck offshore of Chile. Below is the helicorder image for the Da Vinci Science Center's seismometer, as of 9:15 AM EST, 2/27/10.

The live update of this seismometer can be found at http://www.davinci-center.org.
A detailed description of this earthquake can be found at http://earthquake.usgs.gov/earthquakes/recenteqsww/Quakes/us2010tfan.php
This earthquake happened on the plate boundary between the Nazca plate and the South American plate, where the Nazca plate subducts eastward underneath the South American plate. This is the same plate boundary that gives rise to the volcanoes that form the core of the Andes Mountains. The portion of the plate boundary that slipped in this earthquake was between the portion that slipped in a M 9.5 quake in 1960 (the largest earthquake ever recorded by modern instruments), and the portion of the fault that produced a M 8.5 earthquake in 1922. Both of those earthquakes produced tsunamis that affected Hawaii and other areas of the Pacific rim. For more information of these tsunamis and others, see http://www.tsunami.org/index.html.

The live update of this seismometer can be found at http://www.davinci-center.org.
A detailed description of this earthquake can be found at http://earthquake.usgs.gov/earthquakes/recenteqsww/Quakes/us2010tfan.php
This earthquake happened on the plate boundary between the Nazca plate and the South American plate, where the Nazca plate subducts eastward underneath the South American plate. This is the same plate boundary that gives rise to the volcanoes that form the core of the Andes Mountains. The portion of the plate boundary that slipped in this earthquake was between the portion that slipped in a M 9.5 quake in 1960 (the largest earthquake ever recorded by modern instruments), and the portion of the fault that produced a M 8.5 earthquake in 1922. Both of those earthquakes produced tsunamis that affected Hawaii and other areas of the Pacific rim. For more information of these tsunamis and others, see http://www.tsunami.org/index.html.
Sunday, June 14, 2009
Textbooks
What he said! (just substitute science or math for marketing)
You might want to check out some of Seth Godin's other posts. After all, creating motivation is an everyday part of what marketers do. You might also want to check out his TED talk. What could you do in a classroom with his ideas about tribes and leadership?
You might want to check out some of Seth Godin's other posts. After all, creating motivation is an everyday part of what marketers do. You might also want to check out his TED talk. What could you do in a classroom with his ideas about tribes and leadership?
Monday, May 18, 2009
Miocene to Recent sediments of the northern Apennines
The materials we were studying in the Northern Apennines were very young sediments (geologically speaking, at least, where 1 million years is not much time at all). Below is a series of photos and descriptions that attempt to lay out the sequence of these rocks in the way they would be seen in a geologic column, youngest on top.
 At the top of the section are the very recent Quaternary terraces, Qt8 and Qt9. These are 50-year old floodplain deposits that have been incised by downcutting related to gravel mining that began shortly after WWII.
Each of the surfaces separating these units in an unconformity (time passed without deposition of sediment). The lower boundary of Qt8 in this picture is an excellent example of an angular unconformity.

Here we see Qt3 on top of Qt2. The top of Qt2 has a deeply weathered "fossil" soil or paleosol. The presence of carbonate nodules in that soil indicate a prolonged period of warm and dry climate. The lower gravel (Qt2) was deposited about 450,000 years ago and the soil developed about 400,000 years ago
 Here is Qt2 on top of Qt1. Qt1 is the oldest Quaternary gravel stream terrace in the region. It is moderately tilted everywhere along the mountain front and is characterized by a reddish weathering soil at its top. This soil developed about 630,000 years ago
 This is the upper mud in the AEI (Association Emilliano Inferiore - Lower Emillia Association). The AEI consists of alternating lake muds, representing glacial periods, gravels, representing glacial melting, and soils developed on top of the gravels, representing interglacial times. These sediment cycles occur due to 100,000 year cycles in the eccentricity of Earth's orbit. The reddish strata in the background are debris flow gravels that lie on top of this mud.

Here is another mud interval (yellow and grey material at the bottom of the photo), overlain by a thin fluvial gravel and then by debris flows. This is the second of three such cycles in AEI.

Here is a fossil cypress(?) stump at the top of the lowermost AEI mud unit This shows the unit was deposited on land,or in very shallow water
 This is the lowest unit in AEI. This mud contains terrestrial fossils and was deposited in a lake on land. The base of this mud is roughly 800,000 years old.
Somewhere in the AEI unit, should be the most recent magnetic reversal in Earth's history. At this time, the magnetic field went from a period of reversed polarity (Matuyama chron) to a period of normal polarity (Brunhes chron). The Brunhes-Matuyama reversal occurred 780,000 years ago.

These interbedded sands and gravels lie at the very top of the Sabbie Gialle.
This unit is approximately 1 million to 800,000 years old

The muds of the Argille Azzure are overlain by medium to thick bedded sands and gravels of the Sabbie D'Imola (Sand of Imola), locally known as the Sabbie Gialle (Yellow Sand)

In the upper part of the Argille Azzure, fossils are abundant. In particular, there are beds of very coarse calcarenite (calcite sands) made of shells and shell fragments. These beds range from 3.1 Ma (million years ago) to 1.8 Ma, corresponding to the Gelasiano and Piacenzian Ages of the middle Pliocene Epoch.

These grey muds of the Argille Azzure show distinct bedding. Much of the Argille Azzure is completely homogeneous mud with no evident bedding. The differences between the bedded and unbedded parts may reflect differences in the depositional environment, in the sediment supply, r in the degree of bioturbation (churning of the sediment by living creatures). The Argille Azzure was deposited between approximately 4.9 and 1 Ma (million years ago).

Cross-bedded sandstones of the upper Miocene Colobacci Formation. This formation is 5.6-5.3 Ma in age. There is an unconformity (time without deposition) between the Colombacci and the overlying Argille Azzure.

Beneath the Colombacci is a very unique rock unit, formed roughy 6 million years ago. These are the Messinian evaporites. This picture shows bedded gypsum that grew out of the evaporating waters of the Mediterranean Sea. Above these rocks lie layers of gysum crystal conglomerates (resedimented gypsum).

Here is a detailed view of the gypsum crystals that make up the Messinian evaporites in this section.
 At the top of the section are the very recent Quaternary terraces, Qt8 and Qt9. These are 50-year old floodplain deposits that have been incised by downcutting related to gravel mining that began shortly after WWII.
Each of the surfaces separating these units in an unconformity (time passed without deposition of sediment). The lower boundary of Qt8 in this picture is an excellent example of an angular unconformity.

Here we see Qt3 on top of Qt2. The top of Qt2 has a deeply weathered "fossil" soil or paleosol. The presence of carbonate nodules in that soil indicate a prolonged period of warm and dry climate. The lower gravel (Qt2) was deposited about 450,000 years ago and the soil developed about 400,000 years ago
 Here is Qt2 on top of Qt1. Qt1 is the oldest Quaternary gravel stream terrace in the region. It is moderately tilted everywhere along the mountain front and is characterized by a reddish weathering soil at its top. This soil developed about 630,000 years ago
 This is the upper mud in the AEI (Association Emilliano Inferiore - Lower Emillia Association). The AEI consists of alternating lake muds, representing glacial periods, gravels, representing glacial melting, and soils developed on top of the gravels, representing interglacial times. These sediment cycles occur due to 100,000 year cycles in the eccentricity of Earth's orbit. The reddish strata in the background are debris flow gravels that lie on top of this mud.
Here is another mud interval (yellow and grey material at the bottom of the photo), overlain by a thin fluvial gravel and then by debris flows. This is the second of three such cycles in AEI.

Here is a fossil cypress(?) stump at the top of the lowermost AEI mud unit This shows the unit was deposited on land,or in very shallow water
 This is the lowest unit in AEI. This mud contains terrestrial fossils and was deposited in a lake on land. The base of this mud is roughly 800,000 years old.
Somewhere in the AEI unit, should be the most recent magnetic reversal in Earth's history. At this time, the magnetic field went from a period of reversed polarity (Matuyama chron) to a period of normal polarity (Brunhes chron). The Brunhes-Matuyama reversal occurred 780,000 years ago.

These interbedded sands and gravels lie at the very top of the Sabbie Gialle.
This unit is approximately 1 million to 800,000 years old

The muds of the Argille Azzure are overlain by medium to thick bedded sands and gravels of the Sabbie D'Imola (Sand of Imola), locally known as the Sabbie Gialle (Yellow Sand)

In the upper part of the Argille Azzure, fossils are abundant. In particular, there are beds of very coarse calcarenite (calcite sands) made of shells and shell fragments. These beds range from 3.1 Ma (million years ago) to 1.8 Ma, corresponding to the Gelasiano and Piacenzian Ages of the middle Pliocene Epoch.

These grey muds of the Argille Azzure show distinct bedding. Much of the Argille Azzure is completely homogeneous mud with no evident bedding. The differences between the bedded and unbedded parts may reflect differences in the depositional environment, in the sediment supply, r in the degree of bioturbation (churning of the sediment by living creatures). The Argille Azzure was deposited between approximately 4.9 and 1 Ma (million years ago).

Cross-bedded sandstones of the upper Miocene Colobacci Formation. This formation is 5.6-5.3 Ma in age. There is an unconformity (time without deposition) between the Colombacci and the overlying Argille Azzure.

Beneath the Colombacci is a very unique rock unit, formed roughy 6 million years ago. These are the Messinian evaporites. This picture shows bedded gypsum that grew out of the evaporating waters of the Mediterranean Sea. Above these rocks lie layers of gysum crystal conglomerates (resedimented gypsum).

Here is a detailed view of the gypsum crystals that make up the Messinian evaporites in this section.
Friday, May 15, 2009
Catching up after Italy

Well, I didn't get nearly as much blogging done in Italy as I might have hoped. Two big reasons - one is that we spent most of our waking hours as you see on the left, up to our knees in Torrente Stirone.

The other, as you see in the second picture, is that our apartment was a bit remote and had no Internet access of any sort.
So now, I'm back and I'm finally caught up with what was waiting on my desk, so I can get a few updates posted on my time in Italy.
We had a great time. The grad student, whose project this is, Kellen, three faculty working with him, and I all had a chance to work together and we got a lot done. The primary work involved measuring the stratigraphic section and sampling for magnetic intensity and for magnetic reversals. For magnetic intensity, we took bulk samples of the sediment every 0.75 meters or 1 meter of section. Because the rocks were tilted, this corresponded to about 2 to 2.5 meters along the river bank. We needed a way to mark the sample sites and the normal method of using a dot of spray paint was not going to work on these soft and wet muds.
On our very first day, inspiration hit when we stopped for gelato on our way home. The little plastic gelato spoons were brightly colored, had a flat area where we could write a number, and a relatively stiff stem that could be pushed into the mud. Our one Italian speaker asked the proprietor if we could buy some and he responded "This is not a spoon store." We persevered and the next morning, we were able to buy a big bag of gelato spoons from the owner. Here is one of those spoons marking a sample site.

After all the samples had been collected, we removed the spoons. Here's is the first day's take.

When I left Italy, we had collected over 500 of these samples. They will be analyzed for their magnetite content to test the hypothesis that there will be a periodicity to the magnetic intensity that matches the 100,000 year and 400,000 years cycles of eccentricity in Earth's orbit around the sun. These cycles are paralleled by climate cycles, making the magnetic intensity measurements a proxy for climate and allowing the project to evaluate possible links between climate cyclicity and patterns in deformation, if there are any. As this data comes in, I will be working to figure out how students can engage with this data set to understand more about basic concepts in earth science, but first we wait and hope that all those boxes yield something useful.
Coming up next: 6 million years of mountain building and climate, recorded in sediments.
Friday, May 8, 2009
Little Boxes on the Hillside... (or at least on the riverbank
The free Internet at the local library won't talk to Blogger, so it's time for a cell phone update. We have been busy collecting samples of mud for the magnetic study. Every two meters along the bank, we stuff a 2 cm plastic cube with sediment, mostly mud. The boxes have been pre-weighed and numbered, so we have to keep track of which is which and where they get filled. Today, we collected oriented samples to look for magnetic reversals. In order to preserve the orientation while getting it into the box, we had to carve little pedestals of mud and slip the boxes over them, then measure the orientation of the box before cutting the box off of the outcrop, trimming off the excess, and putting on the lid. 9 boxes took 6 hours.
Tomorrow is a field trip then one more day in the river before heading home.
Monday, May 4, 2009
Day 3 in the field: we have measured and sampled more than 60 meters of sand and mud, sampling every .75 m. The rocks are Miocene and Pliocene and are barely lithified. They look like rocks, but you sink in to your ankles when you step in a wet spot. We've also seen a whole set of Quaternary gravel terraces, some of which are tilted by deformation.
More details on Thursday!
Subscribe to:
Posts (Atom)